Know important data about your County
Mandera County

Introduction
Mandera County is located in the North Eastern Province and had a total population of 983,000 in 2024. According to the 2019 census, it had a population of 867,457 people, consisting of 125,763 households and an average household size of 6.9 people per household.
Mandera County has a total land area of 25,939.8 square kilometres and a population density of 33 people per square kilometre.
Mandera County is bordered to the North by Ethiopia, to the East by Somalia, and to the South by Wajir County.

Sub-counties in Mandera County include Mandera West, Banisa, Kutulo, Lafey, Mandera Central, Mandera East, and Mandera North.
Mandera County Economy
Between 2018 and 2022, Mandera County's average Gross County Product at current prices was Ksh 63.15 billion, representing an average county contribution to Gross Value Added of 0.5% within the same period.
Mandera County contributed 0.8% on average to agriculture, forestry, and fishing activities. It also contributed 0.1% on average to manufacturing and 0.5% to service activities.
Mandera had a Gross County Product per capita of Ksh 67,518 in 2022.

Mandera County Poverty Rates
In 2022, Mandera County's overall headcount poverty rate was 72.9%, with 674,000 people estimated to live in poverty. Kenya's overall headcount poverty rate was 39.8% in the same year.
The county also had a hardcore poverty rate of 24.8%, with 229,000 people in Mandera estimated to live in extreme poverty. In Kenya, the hardcore poverty rate in 2022 was 7.1%.
Mandera had a food poverty rate of 60.4%, with roughly 558,000 people estimated to live in food poverty. In Kenya, the food poverty rate was 31.5% in 2022.
The table below shows the distribution of poverty by Constituency in Mandera County in 2019: Banisa 80.5%, Lafey 91.1%, Mandera East 77.1%, Mandera North 88.2%, Mandera South 89.3, and Mandera West 79.7%.
|
Constituency |
Poverty Rate (%), 2019 |
|
Banisa |
80.5 |
|
Lafey |
91.1 |
|
Mandera East |
77.1 |
|
Mandera North |
88.2 |
|
Mandera South |
89.3 |
|
Mandera West |
79.7 |
The mean monthly food and non-food expenditure in Mandera County was Ksh 2,692 in 2022 and Ksh 1,829 in 2022. The percentage share of mean monthly food expenditure in the county was 65.2%, while the share of non-food expenditure was 34.8%.
The major sources of food expenditure in Mandera County were purchase or stock 95.6%, own production 2.3%, and gifts 2%.
In 2021, the mean and median per adult equivalent consumption expenditure in Mandera County were Ksh 4,514 and Ksh 3,498, respectively.
Mandera County Demographics
In 2019, Mandera County had a total population of 867,457, consisting of 434,976 males, 432,444 females, and 37 intersex. Mandera had a median age of 12 years in 2019.
The table below shows the distribution of poverty in Mandera County by sub-county and sex.
|
Sub county |
Male |
Female |
Inter sex |
Total |
|
Mandera West |
48,166 |
50,130 |
4 |
98,300 |
|
Banisa |
78,301 |
74,288 |
9 |
152,598 |
|
Kutulo |
35,799 |
36,593 |
2 |
72,394 |
|
Lafey |
40,476 |
42,976 |
5 |
83,457 |
|
Mandera Central |
71,688 |
85,527 |
5 |
157,220 |
|
Mandera East |
83,538 |
76,095 |
5 |
159,638 |
|
Mandera North |
77,008 |
66,835 |
7 |
143,850 |
|
Total |
434,976 |
432,444 |
37 |
867,457 |
Marital Status
The percentage of women aged 12 and above in Mandera County who were never married was 42.2%. In comparison, those who were in monogamous marriages were 47.1% in 2019. On the other hand, the percentage of women who were married polygamously in the county was 5%, while the widowed were 2.3%. The percentage of the divorced and separated in Mandera was 2.4% and 0.6% in 2019.
Among men aged 12 and above in Mandera County, 54.7% were never married, 32.6% married monogamous, 10.6% married polygamous, 0.5% widowed, 0.6% divorced, and 0.6% separated in 2019.
According to the Kenya Demographic and Health Survey, the median age at first marriage among women aged 20-49 in Mandera County was 19 in 2022. Among women in the county aged 25-49, the median age at first marriage was 18.8 years.
In 2022, the median age at first marriage among men aged 30-54 in Mandera was 25.7 years.
Polygyny
The percentage of women aged 15-49 in Mandera County with one or more co-wives was 26.2%, consisting of 21.9% with one co-wife and 4.4% with more than two co-wives. The percentage of women in the county without co-wives was 73.8% in 2022.
In 2022, 80.3% of men aged 15-49 in Mandera County had one wife, while 19.7% had more than two wives.
Marriage Registration
The percentage distribution of currently married women aged 15-49 in Mandera County whose marriage was registered with the civil authorities was 32.1%, while those whose current marriage was registered with authorities and had a marriage certificate was 5% in 2022.
Teenage Marriages in Mandera County
In 2019, the proportion of married males aged 12-15 and 12-18 in Mandera County was 5.8% and 7%, respectively. Among females of the same age groups, the proportion that was married in Mandera County was 7.2% and 13.6%, respectively.
The rate of teenage pregnancies in Mandera County, consisting of women aged 15-19 who have ever been pregnant, was 13.9% in 2022.
Total Fertility Rate
The Total Fertility Rate of Mandera County was 8 births per woman in 2019, an increase of 10% from a total fertility rate of 7.3 births per woman in 2009. By comparison, Kenya had a total fertility rate of 3.4 births per woman in 2019, a decline of 28.6% from a total fertility rate of 4.8 births per woman in 2009.

In 2019, Mandera County's youth fertility rate was 1.1 births per woman, compared to Kenya's rate of 1 birth per woman.
The Crude Birth Rate of Mandera County was 49.4 births per 1,000 population in 2019, a 10% decline from a Crude Birth Rate of 54.9 births per 1,000 population in 2009. Overall, Kenya had a Crude Birth Rate of 27.9 births per 1,000 population in 2019, a 27.2% decline from a crude birth rate of 38.4 births per 1,000 population in 2009.
Place of Birth and Notification Status
The share of recent births in Mandera County occurring in a health facility was 51.8% in 2019, while the share of births occurring in a non-health facility was 46.7%. Overall, the share of recent births in Kenya occurring in a health facility was 85.8%, while the share of recent births not occurring in a health facility in the country was 14% in 2019.
In 2019, 65.3% of recent births in Mandera County were notified, while 33.8% were not. 90.4% of recent births in Kenya were notified, while 9.3% were not..
Place of Death and Notification Status
In 2019, 23.8% of deaths in Mandera County occurred in a health facility, while 69.6% occurred in the community. In Kenya, 59% of deaths in 2019 occurred in a health facility, while 40% did not occur in a health facility.
The share of deaths in Mandera County that were notified in 2019 was 35.5%. Overall, the share of deaths that were notified in Kenya in 2019 was 85.6%.
Mandera County had a Crude Death Rate (CDR) of 9.1 deaths per 1,000 population in 2019. Overall, Kenya had a Crude Death Rate of 10.5%.
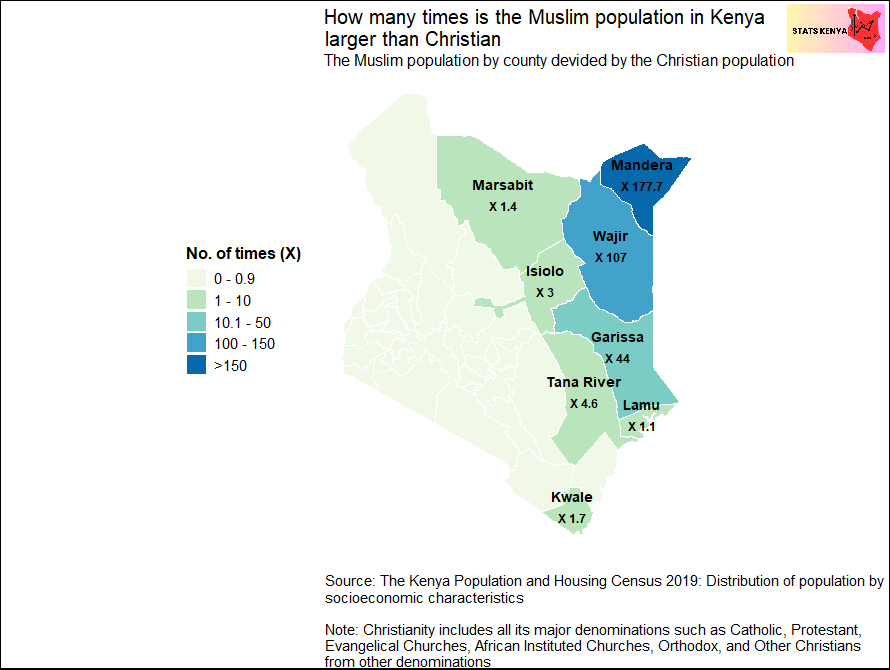
Religious Affiliation
Most residents of Mandera County are Muslims 856,450, Catholic 1,775, and Other Christians 1,615.
|
Catholic |
1,775 |
|
Protestant |
1,185 |
|
Evangelical Churches |
157 |
|
African Instituted Churches |
78 |
|
Orthodox |
10 |
|
Other Christians |
1,615 |
|
856,450 |
|
|
Hindu |
524 |
|
Traditionists |
11 |
|
Other Religion |
88 |
|
No religion Atheists |
24 |
Mandera County Development
- The Rural Access Index (RAI) in Mandera County was 4% in 2019, representing the percentage of the population living within two kilometres of an all-weather road.
- Household access to electricity in Mandera County was 15.8% in 2019, up from 2.5% in 2009.
- In 2019, 34.7% of households in Mandera County had access to improved sanitation, up from 16.4% in 2009.
- In 2019, 36% of households in Mandera County had access to safe drinking water, up from 37.6% in 2009.
- Mandera had 4.9% of its public primary schools connected to electricity, ranking 47th nationally in 2019.
The share of the population in Mandera County owning mobile phones in 2019 was 25.3%. Among women, 76.9% owned any type of mobile phone in Mandera County in 2022, while 15.2% owned a smartphone.
Among men, 78.8% in Mandera owned any kind of mobile phone in 2022, while 38.3% owned a smartphone. The percentage of men and women who had used a mobile phone for financial transactions in the year preceding the 2022 KDHS survey was 57.7% and 43.8%, respectively.
|
Mandera County |
||
|
Mobile Phone Ownership
|
25.30% |
Census 2019 |
|
77.85% |
KDHS 2022 |
|
|
% of the Population Making Mobile Money Transactions |
50.75% |
KDHS 2022 |
|
% of the Population with Mobile Money Accounts |
83.70% |
2021 FinAccess Survey |
|
% of the Population Using the Internet |
4.10% |
Census 2019 |
|
% of Population who have Ever Searched and Bought Goods Online |
0.90% |
Census 2019 |
|
% of Population Using Computer/Tablet/laptop |
2.70% |
Census 2019 |
|
% of the Population Using a Bank
|
8.30% |
KDHS 2022 |
|
6.70% |
2021 FinAccess Survey |
|
Mandera County Finance
In the financial year 2023/24, Mandera County approved a supplementary budget of Ksh13.0 billion, comprising Ksh4.71 billion (36.3%) and Ksh8.29 billion (63.7%) allocation for development and recurrent expenditures, respectively.
The budget estimates represented an increase of 2.3% compared to the previous year when it was Ksh12.71 billion and comprised of Ksh 4.29 billion towards development and Ksh 8.42 billion for recurrent expenditures.
Mandera County Revenue Performance
The main sources of revenue for Mandera County in FY 2023/2024 included:
- Equitable share – Ksh 10.7 billion
- Conditional grants and additional allocations – Ksh 401.9 million
- Own Source Revenue – Ksh 168.6 million
- Cash balances – Ksh 525.0 million
Own Source Revenue in Mandera County
Mandera County generated a total of Ksh 168.6 million from local sources of revenue, inclusive FIF and Ordinary OSR. The major sources of revenue included:
- Land Rents – Ksh 42.5 million (25%)
- Health/Hospital/FIF – Ksh 26.3 million (16%)
- Plot Transfers/Sub Divisions Fees – Ksh 16.4 million (10%)
- Single Business Permit – Ksh 15.7 million (9%)
- Barriers – Ksh 13.8 million (8%)
- Other – Ksh 54.7 million (32%)
Expenditure in Mandera County
On recurrent expenditure, Mandera County spent Ksh 4,461,668,887 on Personnel emoluments, Ksh 3,348,927,938 on Operations and maintenance and Ksh 3,894,111,022 on development expenditure.
The total expenditure in the financial year 2023/24 was Ksh 11,704,707,847.
Pending Bills in Mandera County
In the end of FY 2023/24, Mandera County settled pending bills amounting to Ksh 675.43 million, therefore, as of the end of the FY 2023/24, Mandera had an outstanding pending bill of Ksh2.23 billion.
Mandera County Travel Expenditure
In the FY 2023/24 Mandera County spent Ksh 137,290,000 on Domestic travel and Ksh 25,650,000 on foreign travel. The total expenditure on travel in Mandera was Ksh 162,940,000.
Mandera County MCA Sitting Allowance
The average sitting allowance for Members of the County Assembly in Mandera was Ksh24,845 compared to the national average of Ksh 59,508.
See Now
References
- KNBS. (2022). 2019 Kenya Population and Housing Census: Analytical report on population projections (Vol. XVI, pp. 23-25).
- KNBS. (2022). 2019 Kenya Population and Housing Census: Population by county and subcounty (Vol. I, p. 7).
- KNBS. (2019). 2019 Kenya Population and Housing Census: Population by county and subcounty (Vol. I, p. 9).
- KNBS. (2019). 2019 Kenya Population and Housing Census: Population by county and subcounty (Vol. I, p. 10).
- KNBS. (2023). 2023 Gross County Product: Measuring the economic evolution of counties (pp. 8-10).
- KNBS. (2023). 2023 Gross County Product: Measuring the economic evolution of counties (pp. 15-21).
- KNBS. (2023). The Kenya Poverty Report: Based on the 2021 Kenya Continuous Household Survey (pp. 35-47).
- Commission on Revenue Allocation. (2022). Kenya County Factsheet (3rd ed., p. 120).
- KNBS. (2023). The Kenya Poverty Report: Based on the 2021 Kenya Continuous Household Survey (pp. 27-31).
- KNBS. (2022). 2019 Kenya Population and Housing Census: Analytical report on fertility and nuptiality (Vol. VI, pp. 14-19).
- KNBS and ICF. 2023. Kenya Demographic and Health Survey 2022: Volume 1. Nairobi, Kenya, and Rockville, Maryland, USA: KNBS and ICF. (p. 143).
- KNBS and ICF. 2023. Kenya Demographic and Health Survey 2022: Volume 1. Nairobi, Kenya, and Rockville, Maryland, USA: KNBS and ICF. (pp. 137-140).
- KNBS and ICF. 2023. Kenya Demographic and Health Survey 2022: Volume 1. Nairobi, Kenya, and Rockville, Maryland, USA: KNBS and ICF. (pp. 135-136).
- KNBS. (2022). 2019 Kenya Population and Housing Census: Analytical report on fertility and nuptiality (Vol. VI, pp. 19-21).
- KNBS and ICF. 2023. Kenya Demographic and Health Survey 2022: Volume 1. Nairobi, Kenya, and Rockville, Maryland, USA: KNBS and ICF. (pp. 169-170).
- KNBS. (2022). 2019 Kenya Population and Housing Census: Analytical report on fertility and nuptiality (Vol. VI, pp. 34-42).
- KNBS. (2022). 2019 Kenya Population and Housing Census: Analytical report on fertility and nuptiality (Vol. VI, pp. 43-46).
- KNBS. (2019). 2019 Kenya Population and Housing Census: Distribution of population by socioeconomic status (Vol. IV, p. 422).
- Commission on Revenue Allocation. (2022). Kenya County Factsheet (3rd ed., p. 120).
Number of Muslims in Kenya | Counties with the Largest Muslim Population
Islam is the second-largest ...